Summary
Race, gender and age all play a role in how much credit we’re able to access and whether we’re able to use that credit to the greatest advantage. CreditCards.com has compiled statistics on demographic trends in the credit world.
The content on this page is accurate as of the posting date; however, some of our partner offers may have expired. Please review our list of best credit cards, or use our CardMatch™ tool to find cards matched to your needs.
Credit cards and access to them are not evenly spread across America. One’s likelihood of being approved for credit varies depending on such factors as age, race, ethnicity, gender and income level.
High credit scores are often the key to getting the lowest-interest loans and access to the best credit cards that offer low rates and rich rewards. Yet, certain groups are less likely to have the credit scores needed to be approved for such financial products.
That leads to financial inequities in which different groups find themselves on uneven playing fields. Yet, despite the differences among demographic groups, one thing most have in common is the desire to minimize their debt load and get ahead.
Credit scores by race and ethnicity
People of color are less likely to have access to credit than white Americans.
- In 2020, 87% of white consumers had a credit card, compared to 72% of Black Americans and 76% of Hispanics.1
- However, Asian Americans buck this trend. In fact, 92% of Asian Americans had access to a credit card in 2020.2
- In fact, Asian Americans and white Americans are more likely than other groups to have multiple credit cards. Both of those groups have, on average, 2.1 credit cards compared to 1.8 for Latinos and 1.7 for Black Americans, according to a survey by The Ascent.2
One reason people of color are less likely to have credit cards could be that they tend to have lower credit scores than white Americans. People of color are also more likely to be “credit invisible,” meaning they have no credit history. In 2020, 18% of Black Americans had no credit score, compared to 15% of Latinos, 13% of white Americans and 10% of Asian Americans.2
Not only are Asian Americans least likely to be credit invisible, but they are most likely to know their credit scores. More than 7 in 10 – 71% – of Asian Americans know their credit scores compared to 69% of white Americans and 61% of Latinos and Black Americans, respectively.2
A 2021 Urban Institute study provided more insight into credit score disparities by race and ethnicity.
- In October 2020, white Americans had a median credit score of 725 compared to 661 for Latinos, 612 for Black Americans and 603 for Native Americans. Interestingly all groups experienced an increase in their credit scores over the course of the pandemic.3
- The study also found that communities of color tended to have a higher percentage of people with subprime credit scores. In October 2020, 46% of residents in majority Native American communities had subprime credit scores. That was followed by 45% in majority Black American communities, 32% in majority Latino communities and 18% in majority white American communities.3
Those findings were in line with a 2017 Urban Institute study that found that predominantly nonwhite areas in 50 out of 60 cities studied had median credit scores that were 660 or lower, and most of the cities had median credit scores that were 600 or lower. In comparison, predominantly white areas in only four of the 60 cities studied had median credit scores that were below 660.4
Credit scores by gender
There is no clear winner in the gender wars when it comes to credit scores.
In the second quarter of 2019, the average FICO score for men was 705, compared to 704 for women.5
However, historically, among single men and women, men have the upper hand.
- A 2018 Federal Reserve report found that the median VantageScore among single men between 21 and 30 was 786, compared to 776 among single women in that age group.
- Among single men between the ages of 31 and 40, the median VantageScore was 828 compared to 806 for women the same age.6
In 2019, members of the LGBTQ community were more likely to describe themselves as having “poor” or “very poor” credit, according to a study by the Center for LGBTQ Economic Advancement & Research (CLEAR).
- In fact, 16.1% of LGBTQ adults described their credit in that way compared to 8.2% of non-LGBTQ adults.7
- Among LGBTQ respondents who identify as female, 20.7% said their credit was “poor” or “very poor” compared to 9.8% of non-LGBTQ respondents who identify as female.7
- Among those who identify as male, 12.3% of LGBTQ respondents said they had “poor” or “very poor” credit compared to 6.6% of non-LGBTQ males.7
For some people, race and gender both have an impact on their access to credit:
- Nearly a third – 31.3% – of Black LGBTQ adults said they had “poor” or “very poor” credit, compared to 17.1% of Black non-LGBTQ adults.7
- Among Latinos, 18.8% of LGBTQ adults said they had “poor” or “very poor” credit, compared to 12.3 % of non-LGBTQ adults.7
- Among white Americans, 13% of LGBTQ adults said they had “poor” or “very poor” credit, compared to 6.4 % of non-LGBTQ adults.7
Lower credit scores may be contributing to LGBTQ struggles in accessing credit. Among consumers who applied for credit in the year leading up to 2019, 35.1% of LGBTQ consumers had their applications rejected compared to 21.3% of non-LGBTQ consumers.7
Credit scores by age
With age comes wisdom – and apparently better credit. Experian’s 2020 Consumer Credit Review found that the oldest Americans had the highest credit scores.
In 2020, the Silent Generation, those 75 and over, had an average FICO score of 758. They were followed by:
- Baby boomers – those 56-74 – with an average FICO score of 736 8
- Generation X – those 40-55 – with an average FICO score of 698 8
- Millennials – those 24-39 – with an average FICO score of 679 8
- Generation Z – those 18-23 – with an average FICO score of 674 8
Of all age groups, millennials made the most progress in improving their credit scores between 2019 and 2020. Millennials saw, on average, an 11-point increase in their credit scores. Generation X scored a 10-point increase, Generation Z saw a seven-point increase, baby boomers saw a five-point increase and the Silent Generation saw a one-point increase.8
Millennials have historically taken a cautious approach to debt. In the first quarter of 2019, millennials carried less credit card debt than average, reporting $4,712 in outstanding credit card balances compared to the national average of $6,028.
However, that may be changing, as millennials – those between 23 and 38 in 2019 – saw their average credit card debt increase by 7% in 2019 from the year before. On top of that, millennials appear to rack up debt with age. In Q1 2019, 23-year-old millennials had on average $2,288 in credit card debt while 38-year old millennials had on average $6,675 in credit card debt.9
Generation Z – those between 18 and 22 in 2019 – also saw their average credit card debt increase by 11% between Q1 2018 and Q1 2019 from $1,851 to $2,057.9
Credit scores by income bracket
Demographics aren’t the only factor that can impact your access to credit. The amount of money you make can also come into play, though there is contradictory evidence about how much of a role income truly has.
Consumers with higher income are more likely to have higher credit scores.
- In the first half of 2020, a Federal Reserve Bank of New York report found that the median credit score for consumers with a high income was 774.10
- The study also found that consumers in lower-income areas were less likely to have credit cards than those in higher-income areas.10
However, an Americans Bankers Association study released in 2021 suggests that a lower income doesn’t necessarily make one a riskier borrower.
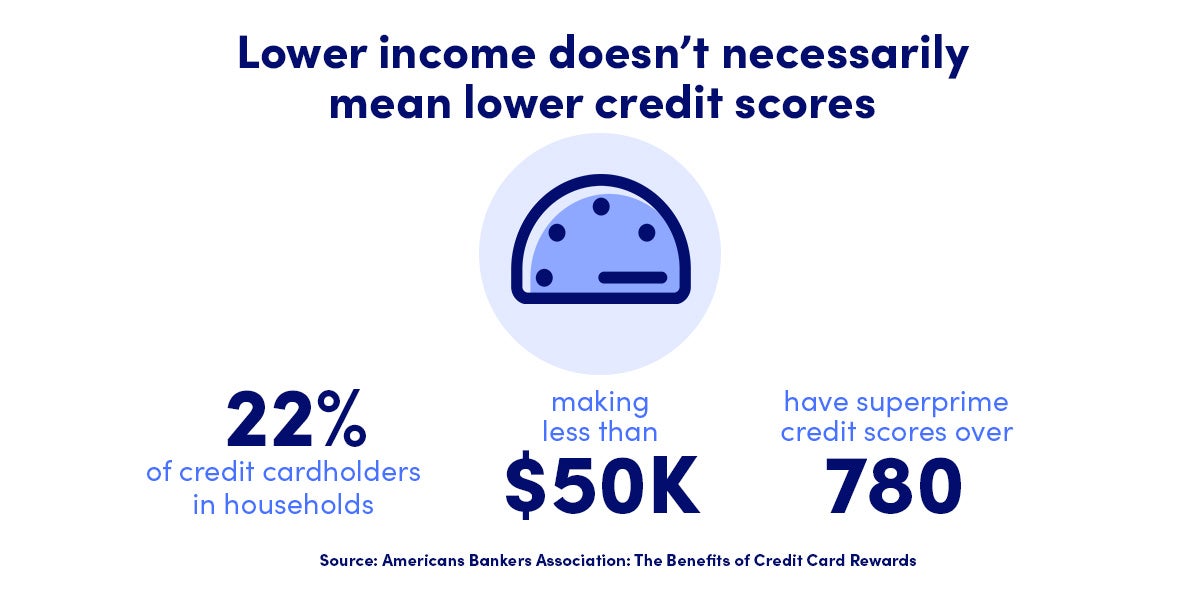
- In fact, 22% of credit cardholders in households that make less than $50,000 per year – deemed lower income by the study – have superprime credit scores, which are over 780.
- Another 35% of lower-income cardholders have prime credit scores – between 680-780.11
- Lower-income consumers also don’t appear to be more likely to carry credit card debt from month to month than higher-income cardholders.
- Among the lowest-income consumers with superprime credit, one-third of them carry revolving credit card debt. Among the highest-income consumers with prime credit, 55% carry revolving debt.11
- Lower-income consumers are also very likely to use rewards credit cards, though slightly less likely than the general population, with 77% of lower-income cardholders possessing an active rewards card, compared to 86% of the general population of cardholders.11
Bottom line
Credit scores can make a huge difference in a consumer’s ability to move forward in life, whether they’re looking to finance unexpected costs, buy a house or even find a job. While one’s credit score should be a snapshot of their past financial actions, the fact that certain groups disproportionately experience lower credit scores and less access to credit raises questions about how deep financial inequities truly run.
- Board of Governors of the Federal Reserve System: Report on the Economic Well-Being of U.S. Households in 2020
- Motley Fool’s The Ascent: Study: Race and Personal Finance in America
- Urban Institute: Credit Health During the COVID-19 Pandemic
- Urban Institute: The Financial Health of Residents
- Experian: Women and Credit 2020: How History Shaped Today’s Credit Landscape
- Board of Governors of the Federal Reserve System: Gender-Related Differences in Credit Use and Credit Scores
- The Economic Well-Being of LGBT Adults in the U.S. in 2019
- Experian 2020 Consumer Credit Review
- Experian: Millennials and Credit Card Debt
- Federal Reserve Bank of New York: The State of Low Income America: Credit Access and Debt Payment
- American Bankers Association: The Benefits of Credit Card Rewards
Editorial Disclaimer
The editorial content on this page is based solely on the objective assessment of our writers and is not driven by advertising dollars. It has not been provided or commissioned by the credit card issuers. However, we may receive compensation when you click on links to products from our partners.

Essential reads,
delivered straight to your inbox
Stay up-to-date on the latest credit card news 一 from product reviews to credit advice 一 with our newsletter in your inbox twice a week.